
Technical Analysis of Indian Stocks
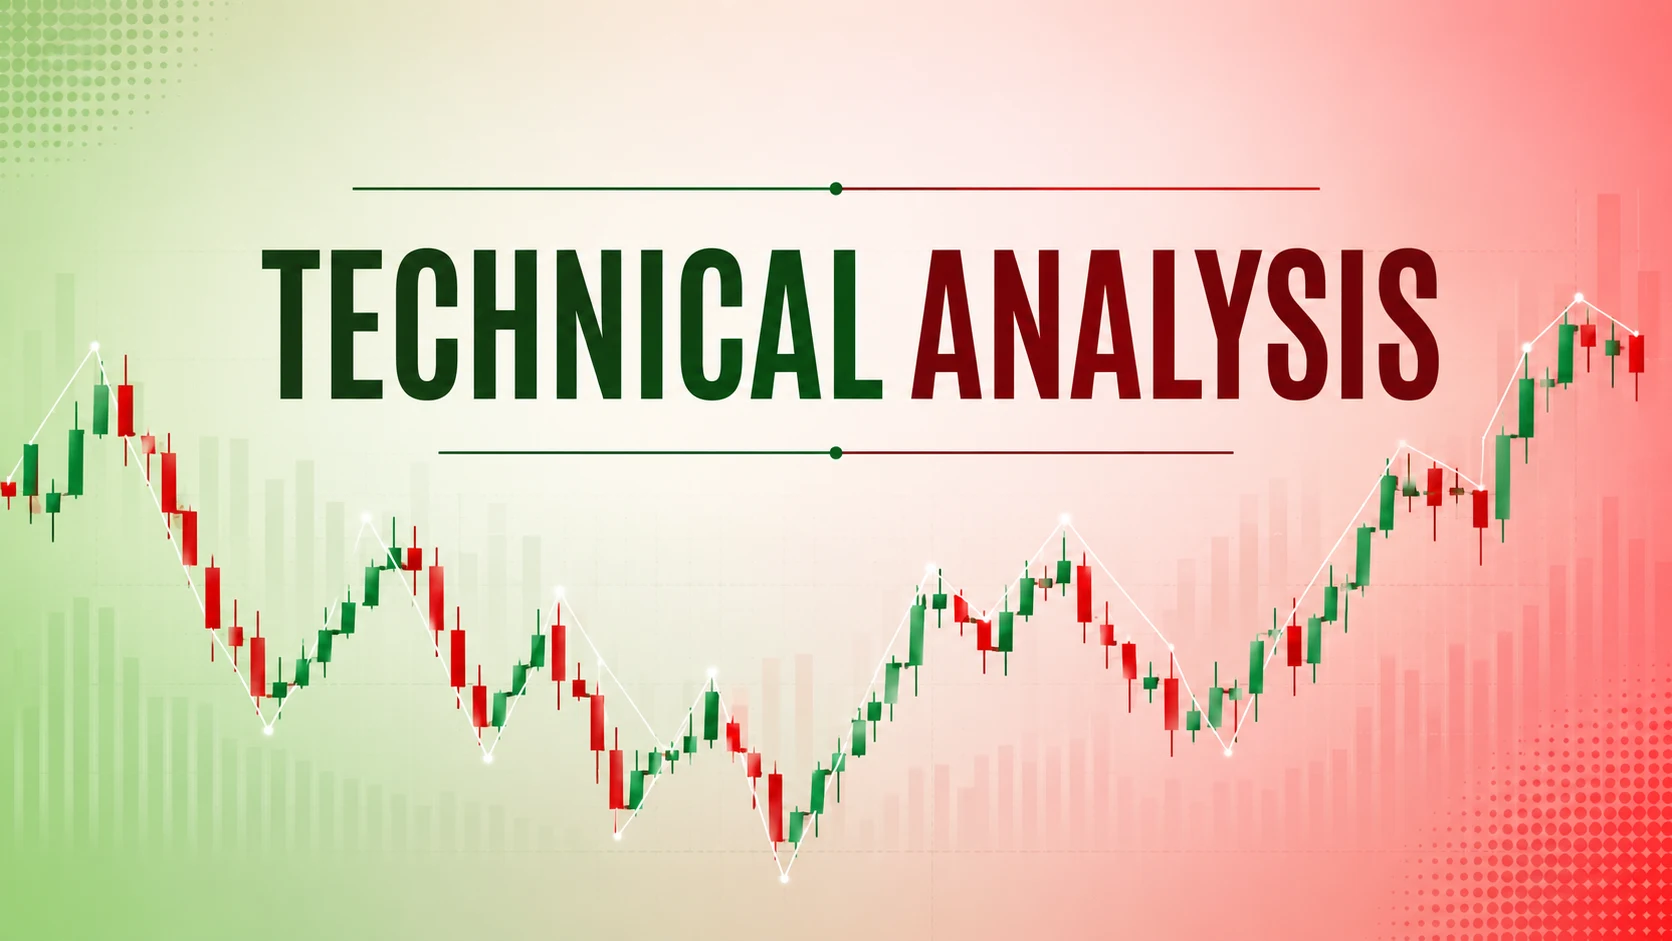
Technical analysis of Indian stocks is a method used to study price movements and market trends with the help of charts, indicators, and historical data. Unlike fundamental analysis, which focuses on a company's financial performance, stock market technical analysis helps traders identify the right time to buy or sell a stock. It is widely used by intraday traders, swing traders, and even long-term investors to understand market behavior and improve trading decisions. By learning technical analysis for beginners, investors can develop a structured approach to trading and avoid emotional decisions.
One of the main principles of technical analysis is that stock prices move in trends and that historical price patterns often repeat over time. Traders use various chart types, such as candlestick charts, line charts, and bar charts, to study price action. Popular concepts like support and resistance, trend lines, and chart patterns help traders identify potential entry and exit points. Understanding these basics is essential for anyone interested in learning how to do technical analysis effectively.
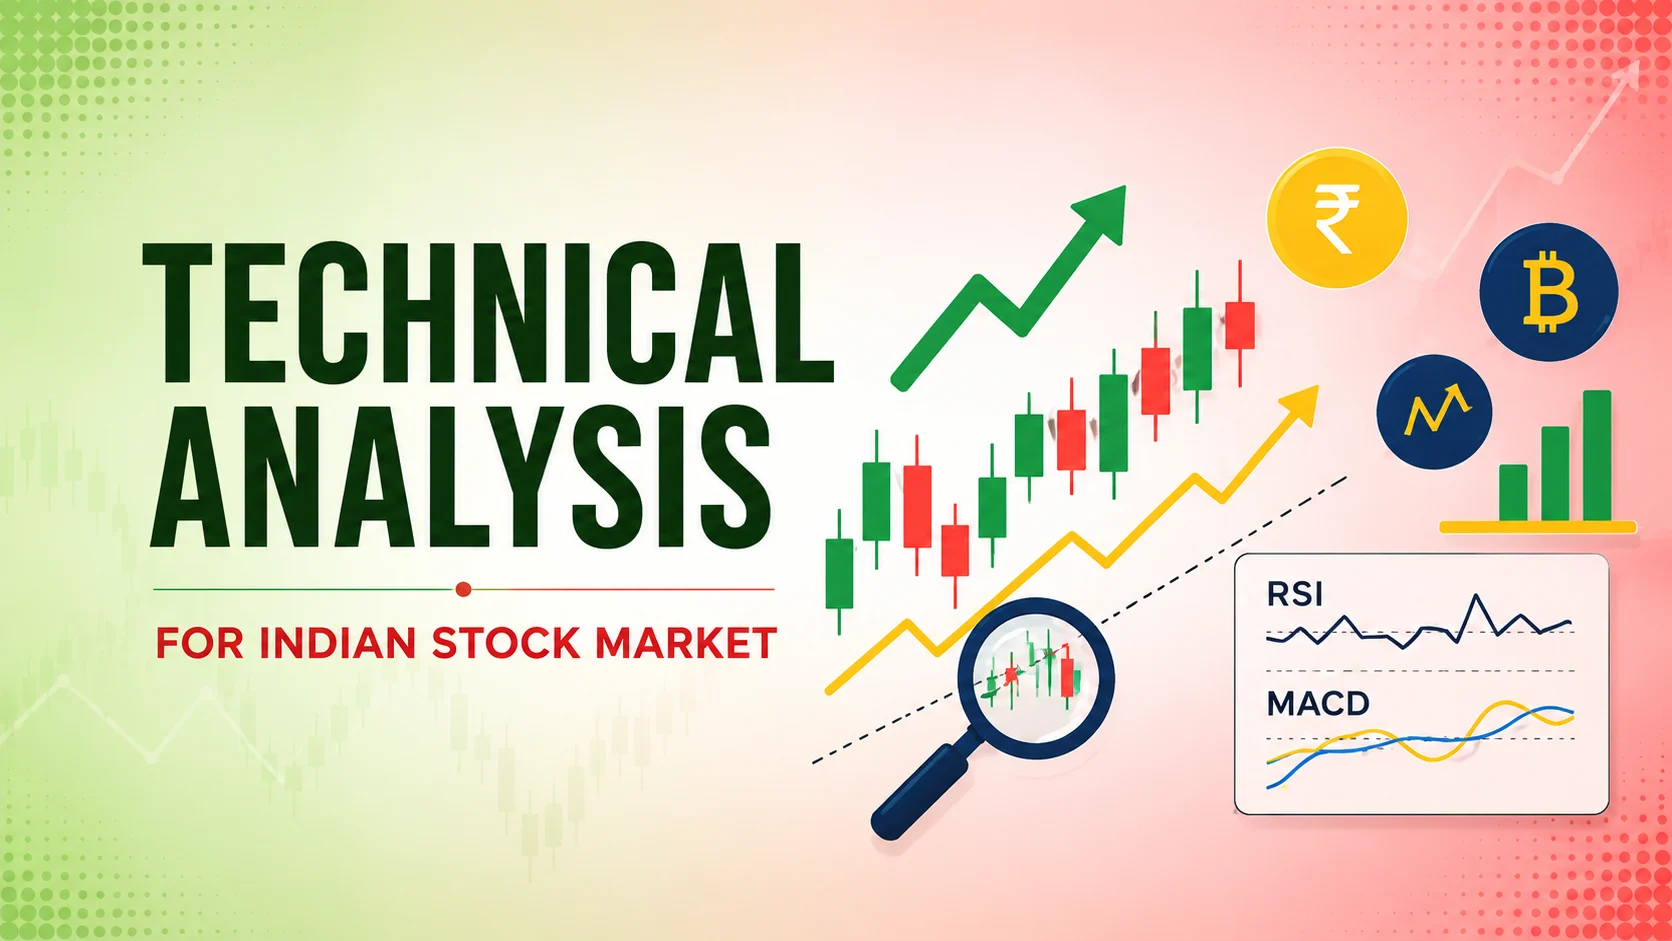
Technical indicators also play an important role in stock market technical analysis. Tools like the RSI indicator, MACD indicator, Moving Average, and Bollinger Bands help traders analyze momentum, trends, and possible reversals. These indicators are widely used in the Indian stock market because they provide additional confirmation before taking a trade. However, experienced traders often combine indicators with price action and chart patterns instead of relying on a single signal.
For beginners, learning technical analysis of Indian stocks can seem difficult at first, but with regular practice and proper risk management, it becomes easier to understand. Studying candlestick patterns, trend analysis, and trading psychology can significantly improve trading performance. Whether you are interested in intraday trading, swing trading, or positional trading, technical analysis helps you understand market behavior and make better decisions. Another important aspect of technical analysis is risk management. Successful traders always use stop-loss orders and maintain proper risk-reward ratios. Even the best trading strategies can produce losses, so managing risk is just as important as finding profitable opportunities.
1. What is Technical Analysis in the Stock Market?
Technical analysis is a method used to study stock price movements and market trends with the help of charts and indicators. Unlike fundamental analysis, which focuses on company performance, technical analysis helps traders identify entry and exit points. It is widely used by beginners and professional traders to understand market behavior. By learning technical analysis of Indian stocks, investors can make better trading decisions and improve risk management. Common tools used in technical analysis include candlestick charts, support and resistance levels, and moving averages. Understanding these concepts is one of the first steps for anyone interested in stock market trading.
Important Concepts :-
Key Takeaways :-
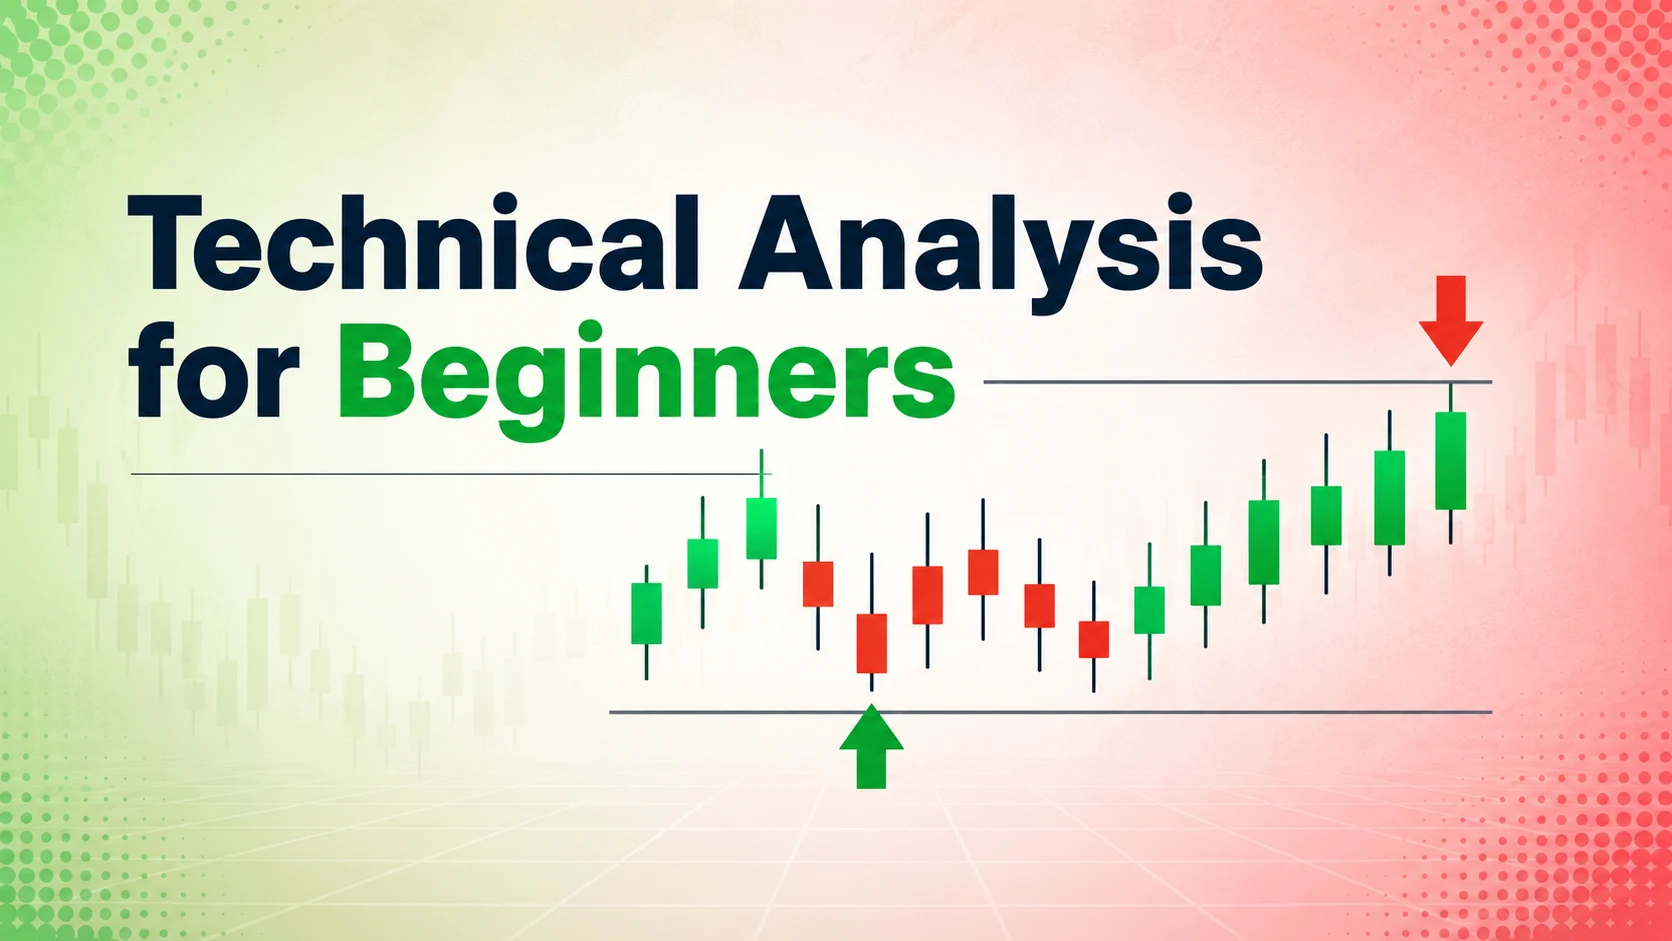
2. Understanding Candlestick Patterns and Chart Types
Candlestick charts are one of the most important parts of technical analysis. They show the opening price, closing price, high, and low of a stock during a particular time period. Beginners learning technical analysis for beginners often start with candlestick patterns because they help identify market sentiment. Popular patterns include Doji, Hammer, Bullish Engulfing, and Shooting Star. Apart from candlestick charts, traders also use line charts and bar charts. Understanding these patterns can help investors predict possible price movements and improve their trading strategies.
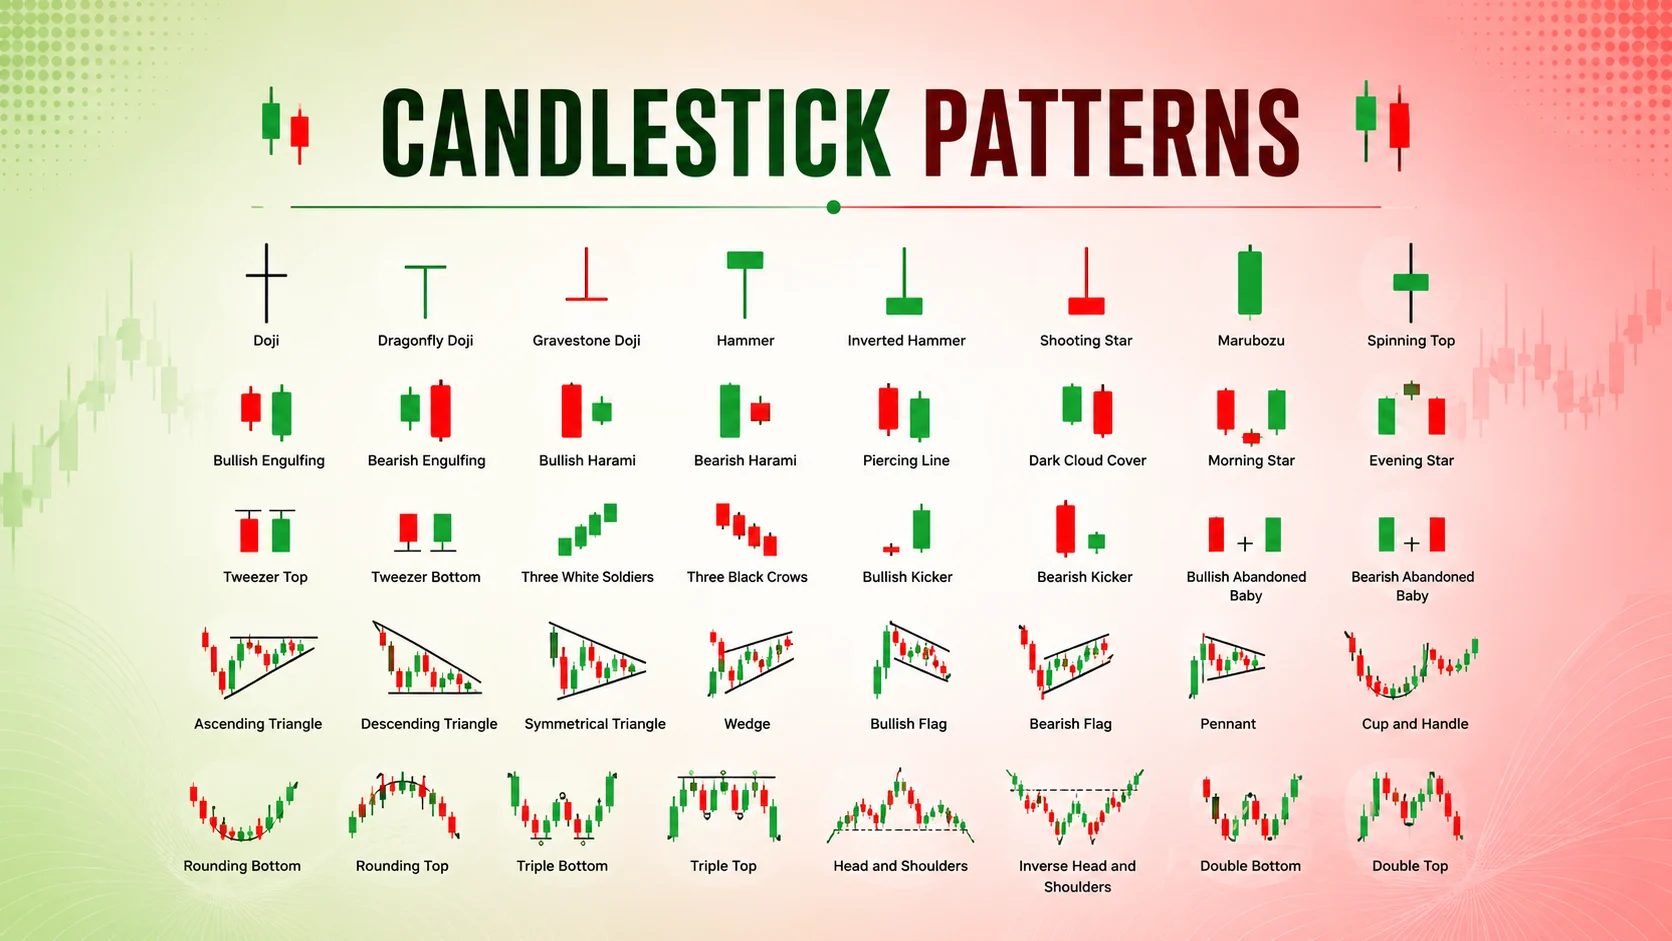
Popular Patterns :-
Why They Matter?
3. Support and Resistance: The Foundation of Trading
Support and resistance are among the most important concepts in stock market technical analysis. Support is a price level where buying demand increases, while resistance is a level where selling pressure rises. Traders use these levels to decide when to buy or sell stocks. Understanding support and resistance helps traders identify breakouts, stop-loss levels, and profit targets. These concepts are useful for intraday trading, swing trading, and positional trading. Learning support and resistance can significantly improve trading accuracy and risk management.
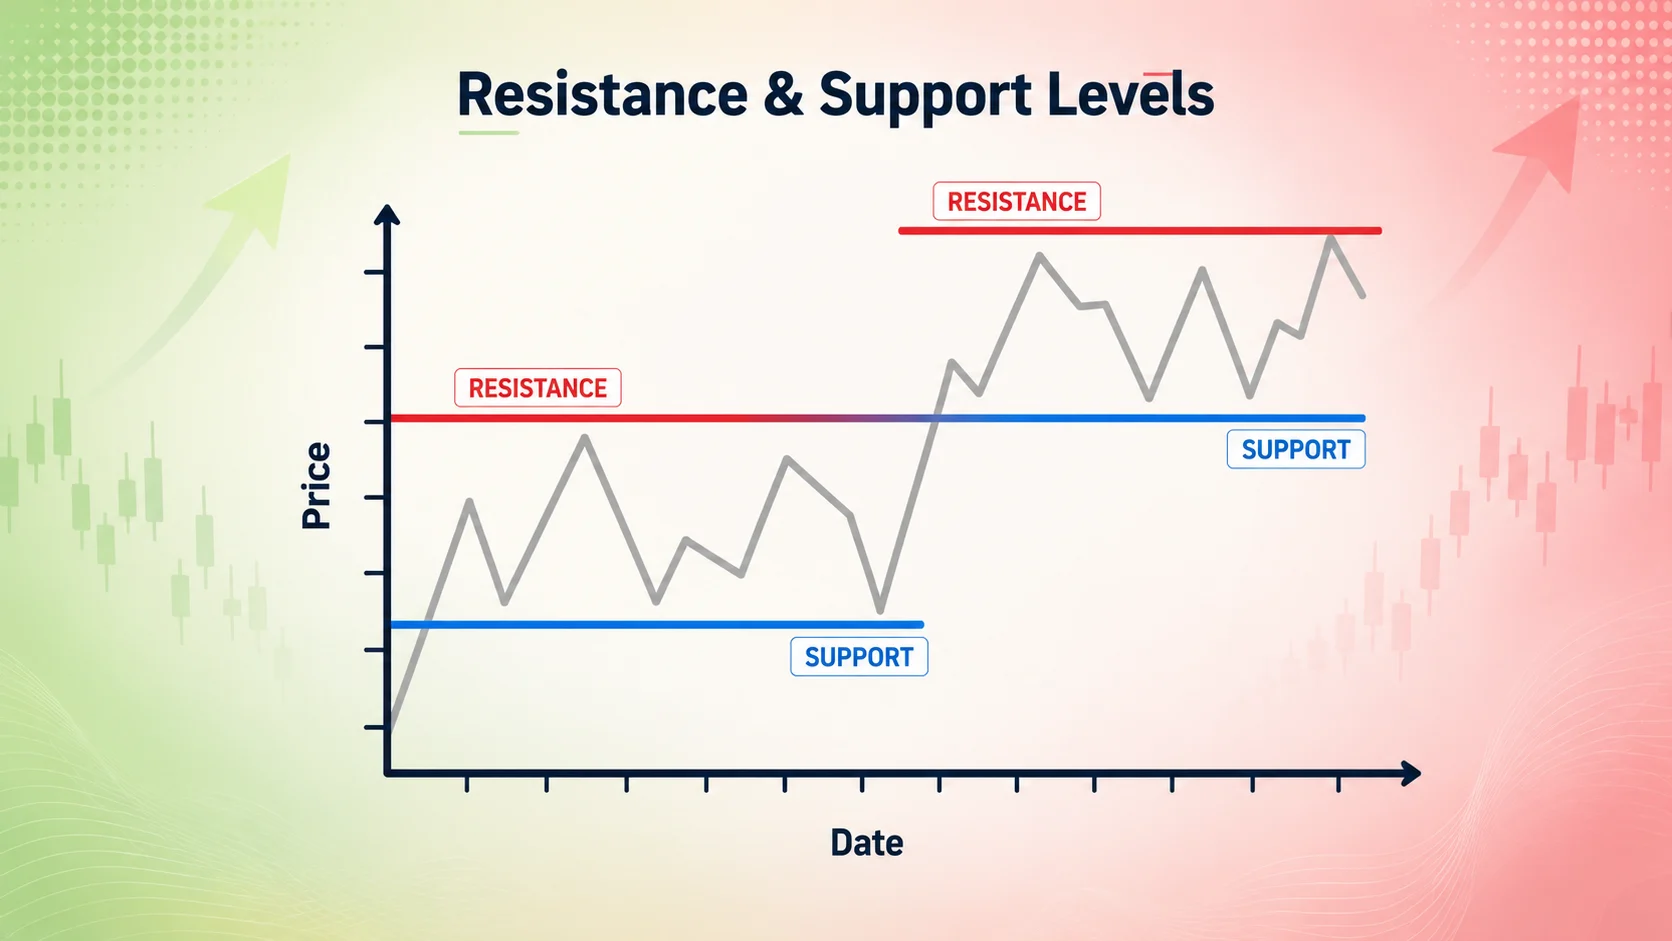
Benefits of Support and Resistance :-
Key Terms :-
4. Popular Technical Indicators Every Beginner Should Know
Technical indicators are mathematical tools used to analyze stock price movements. Some of the most popular indicators include RSI (Relative Strength Index), Moving Average, MACD, and Bollinger Bands. These indicators help traders identify trends, momentum, and potential buying or selling opportunities. Beginners who are learning how to do technical analysis should start with simple indicators before moving to advanced strategies. Combining indicators with price action can increase the probability of successful trades and improve overall trading performance.
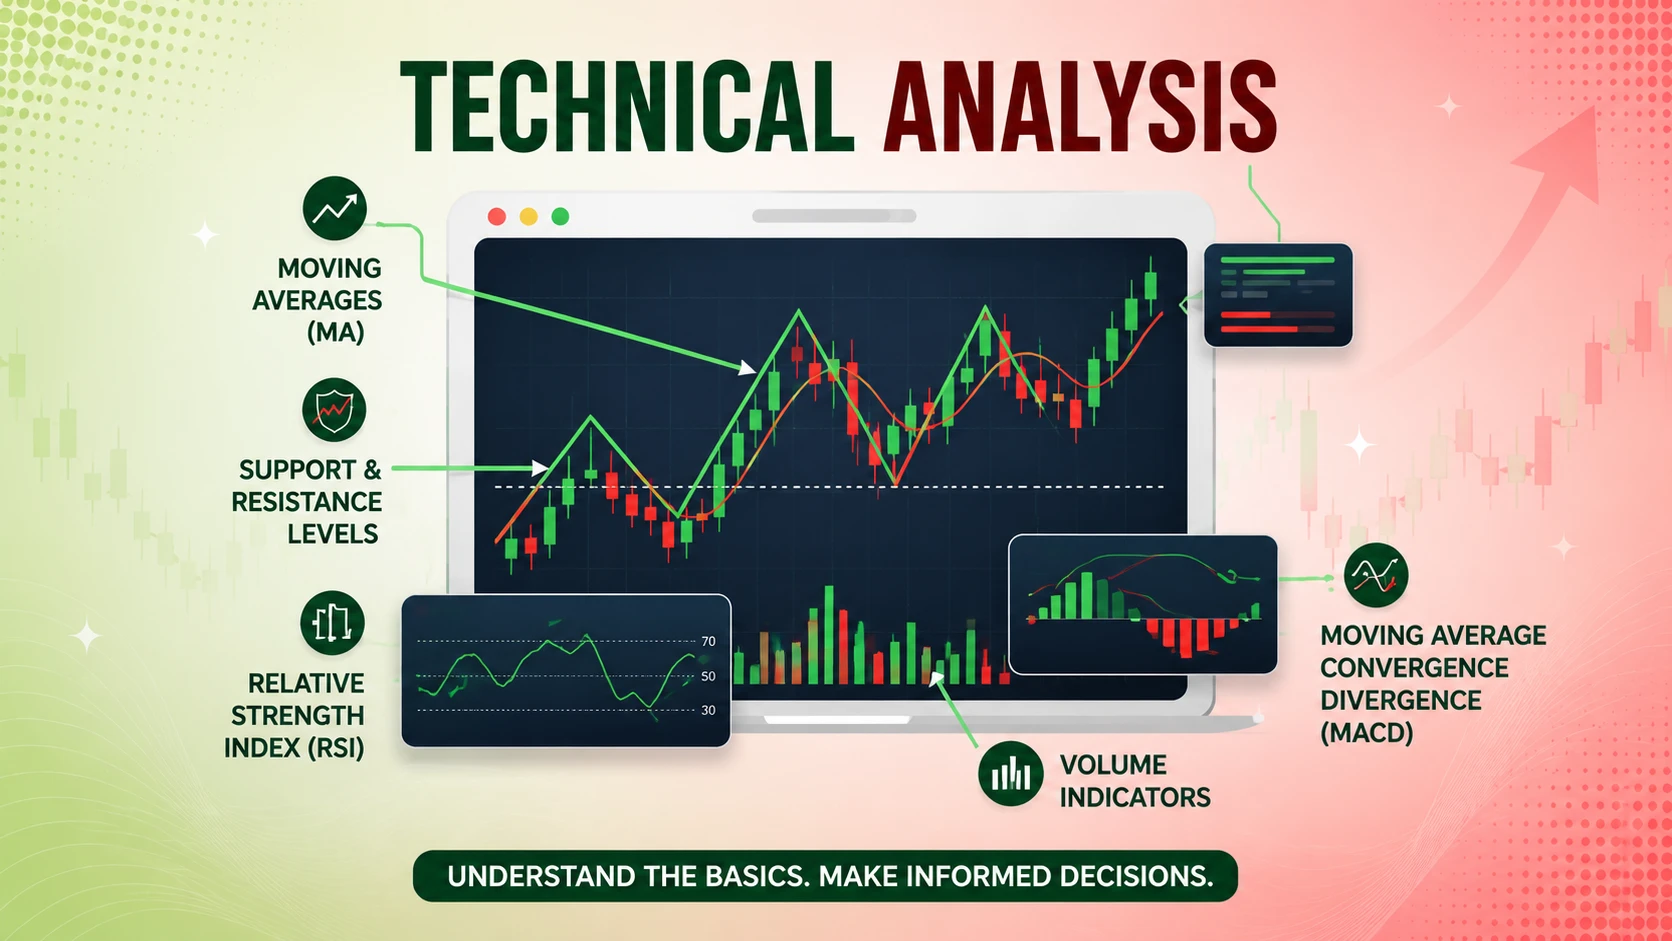
Most Popular Indicators :-
Why Traders Use Indicators :-
5. How to Start Technical Analysis for Beginners
Starting technical analysis does not require advanced knowledge. Beginners should first understand chart patterns, support and resistance, and basic indicators. They should also learn risk management and avoid trading based on emotions. Practicing with historical charts and using a trading journal can help improve consistency. Technical analysis of Indian stocks becomes more effective when traders combine multiple tools instead of relying on a single indicator. Patience, discipline, and continuous learning are essential for long-term success in the stock market.